PolyFIT 1.1
POLYNOMIAL 2D & 3D CURVE FITTING PROGRAM
Before you click below to purchase PolyFit, print this page of instructions. When you click 'Purchase PolyFit 1.1' below, you will be taken to a demographics form containing a download link. When you click on that link, a PDF file will be downloaded to your downloads folder. Open the PDF file and you will see two final download links, one for Mac & one for Windows. When you click one of those download links you will be guided to install PolyFit.
PolyFit 1.1: User’s Manual
Introduction & Overview
PolyFit was written because I found it impossible to find an easy online capability for doing polynomial
curve fitting, and specifically one capable of fitting two independent variables (i.e., families of data points).
PolyFit is very easy to use. PolyFit can fit polynomial functions to linear, quadratic, cubic, or exponential
data using the form Y = f(X), and it can also fit a family of curves using the form Y = f(X,Z). For example: if
you wanted to fit data on vehicle fuel consumption vs. both speed and gasoline ethanol content, you would
define vehicle fuel consumption as Y, speed as X, and gasoline ethanol content as Z. PolyFit could then fit a
single quadratic or cubic polynomial to all these data.
PolyFit also allows you to enter estimated errors in the Y values, either as standard deviations or as
coefficients of variation. If you have done a fit and you find that a region of your fit-space has exceptionally
large errors, you can repeatedly enter the data values in this region two or more times. This will reduce the
errors in this region by shifting them to less important regions of your fit-space.
PolyFit reads data from an EXCEL file and can return the results to an EXCEL file using cut and paste from
the application.
PolyFit can be downloaded to your PC either as a Mac or as a Windows application.
PolyFit output also provides a comprehensive set of goodness-of-fit parameters.
Instructions for using PolyFit 1.1
Step 1:
Prepare your EXCEL input file.
Open an EXCEL file. The default order of columns for 2D fits is: X, Y, SD (or CV), ‘SPECIFIC X values’ (ignore these for now). For 3D fits: X, Z, Y, SD (or CV), ‘specific X values’, ‘specific Z values’. Use the first row to label the columns with your specific variable names. The SPECIFIC X and/or SPECIFIC Z values columns let you specify how you would like to see the fit documented. For example: you may want to have the fitted Y values listed corresponding to specific integer values of X, i.e., X = 2, 3, 4, 5, etc. The QUICK CALCULATOR gives you the calculated Y values for the column of specific X and/or Z values that you have specified in the input file. This is a useful feature for tabulating your fitted data for publication purposes. Note, that the first row of the input file is only for column captions.
Step 2:
Click LOAD EXCEL DATA. You will be asked for the name of the EXCEL input file, which you should select.
Step 3:
In SELECT FIT TYPE, select the type of fit you want to do, i.e., LINEAR-2D, QUADRATIC-2D, CUBIC-2D, EXPONENTIAL-2D, QUADRATIC-3D, OR CUBIC-3D.
Step 4:
In SELECT VARIABLES, use the Y, X, and Z (for 3D fits) or just Y and X (for 2D fits) pull-downs to reassign your own variable names; e.g., in the example given above, set Y to correspond to vehicle fuel consumption, set X to correspond to speed, and set Z to correspond to gasoline ethanol content.
Step 5:
In SD WEIGHTING, select SD, CV, or NONE.
Step 6:
Click the FIT button to start the mathematical calculation.
Results
Under FIT RESULT, polynomial coefficients C1 through Cn are listed with their computed values.
Under INPUT & OUTPUT DATA, multiple columns of numbers appear. These columns in sequence are X, Z (only for 3D fit), Y, FITTED-Y, SD (or CV), & %-ERROR. The FITTED-Y and the %-ERROR are the output data, the rest are a mirror of the input data you entered.
To transfer the results back to your EXCEL input file, select all the columns in INPUT & OUTPUT DATA (just like selecting data in an EXCEL spreadsheet), then copy and paste into your EXCEL input file (or any other EXCEL file). Note, due to space restrictions, some rows and columns in the INPUT & OUTPUT DATA results section may be hidden, so bear this in mind when you cut-and-paste.
If you want to graph your input and output data, choose the PLOT button which corresponds to the type of plot you want; e.g., Y(X), Y(Z), or 3D plots. The plots can be copied using screen-grab and paste into any file you wish.
If you want to try a different order fit, or change some input data, just edit these in your EXCEL input file, then reload your modified input file, select the new desired fit in SELECT FIT TYPE, and click FIT again.
Example
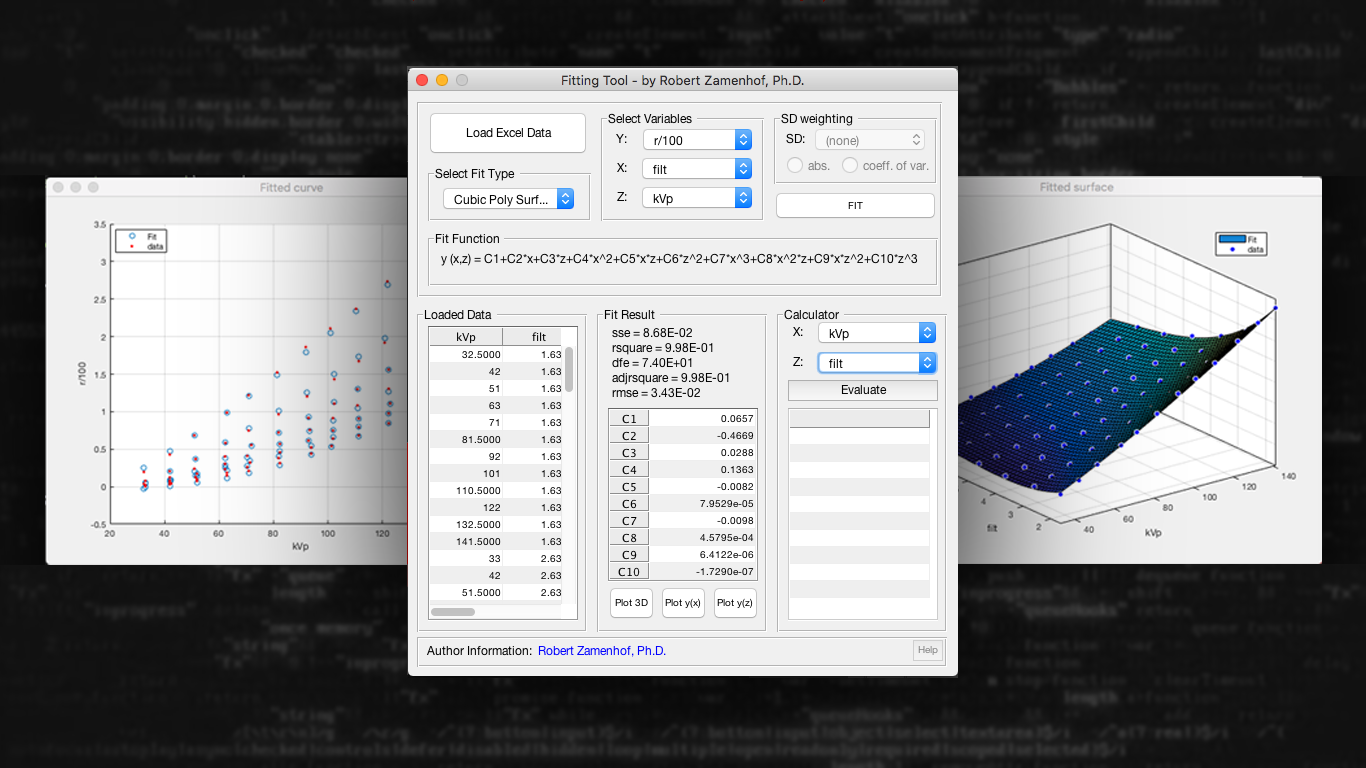
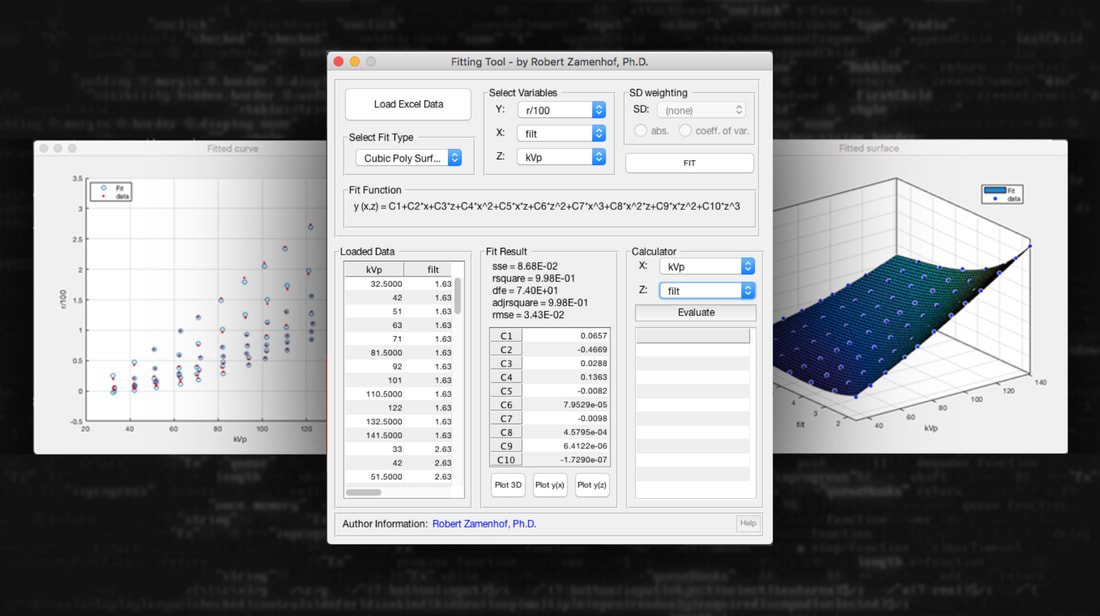
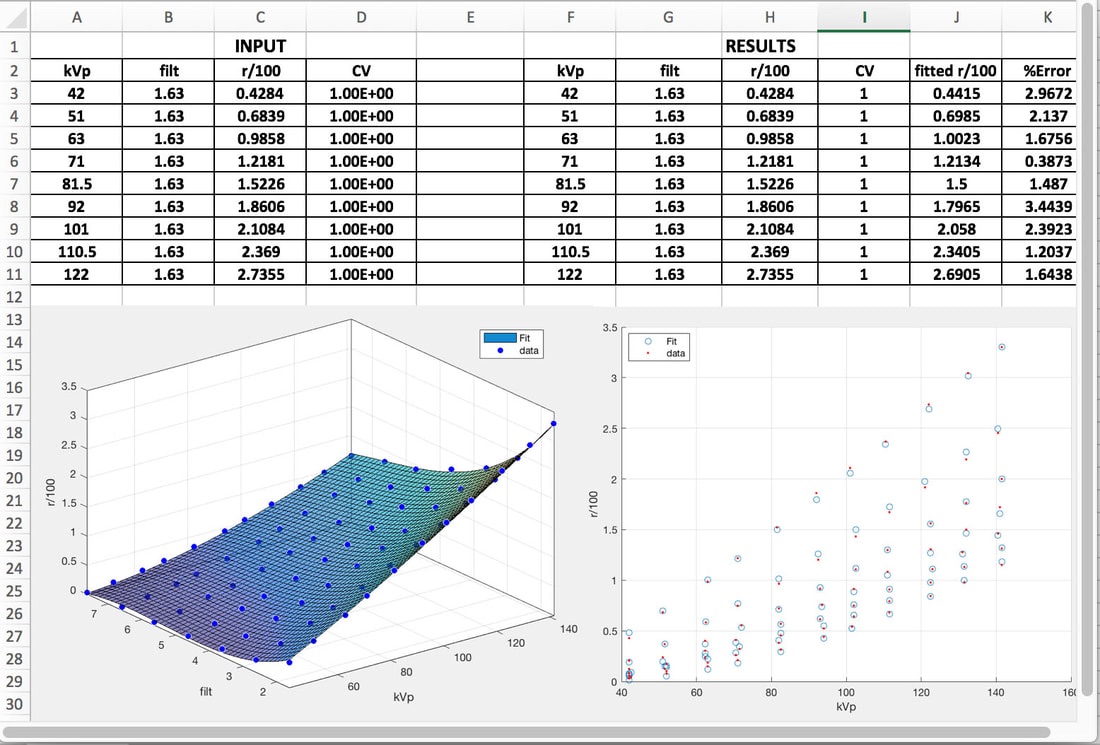
The figure below shows the PolyFit dashboard after a 3D fit has been done, the corresponding input EXCEL file, which also contains the pasted results of a 3D cubic polynomial fit, as well as two sample plots.
As stated above, the default column order is A=Z, B=X, C=Y, D=SD or CV. Using the SELECT VARIABLES pull-down, X was correlated with 'filt', Z with 'kVp', Y with 'r/100', and SD with CV.
After the results have been computed, the input & output data columns in the INPUT & OUTPUT DATA section of the PolyFit dashboard are copied and pasted back into the EXCEL input spreadsheet, with input data in columns A-D, and results in columns J-K.
Finally, by clicking on PLOT Y(Z), a 2D plot is obtained, and by clicking on PLOT 3D, the 3D (or ‘surface’) plot is obtained.
A 2D (graph) and 3D (surface plot) are shown below the EXCEL data columns. Note, the number of input data has been truncated to improve clarity; however, the two plots reflect all input data points.
PolyFit 1.1 Dashboard
Polyfit 1.1 Input, Output, & 2D & 3D Plots
Goodness-of-fit
Five goodness-of-fit parameters are calculated for each polynomial fit. However, the degrees-of-freedom adjusted R-squared ('adjrsquare') metric is probably the most useful single value indicator of the goodness of the fit. For the present example (see dashboard figure), the degrees-of-freedom adjusted R-squared = 0.998...that's a good fit!
[Polyfit 1.1 is a copyrighted visual basic application by RG Zamenhof, 2018]
*******************************
After you've had a chance to try PolyFit, would you please comment on your experience or suggest any improvements using the contact form below. THANK YOU!


